w2jc Customized Indicators
for TradeStation Users
http://tsindicators.jimcooper.biz
[ Last revised: 2021 August 09 ]
Over the past few years, having become fairly good at EZ-Language programming and never being satisfied with the 'stock' indicators that come with Tradestation, I have both created new indicators and greatly enhanced many of the stock indicators to add features I thought would be useful on my charts.
Prompting from friends and other users is nudging me down the path of making these various creations available to other TradeStation users in the hope that they too will find them useful.
Before I can make any of my customized, enhanced indicators available for a fee I need to prepare a description and instructions for each one - a User's Guide. Therefore, if I continue with this venture I'll be making them available one at a time -- as I can get them properly documented
(I strongly believe in readable and useable documentation!).
So far, we have publicly released (on a very limited basis) our PINBALL FINDER scan and chart display, the DIRCON Directional Control console package, and the very handy UNIVERSAL MOVING AVERAGE indicator (see below). Versions of the Ichimoku Cloud indicator and trading package are now in use, as are our MACD and Composite ADX indicators.
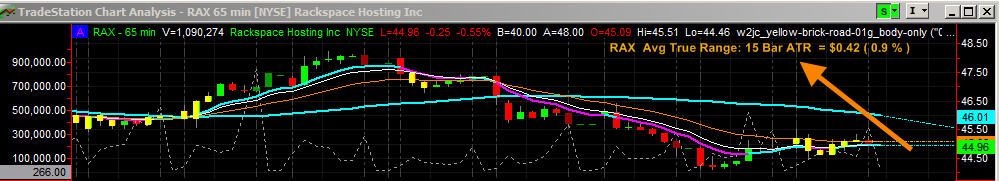
Volatility Stops - similar to what is in TC2000 and Think or Swim
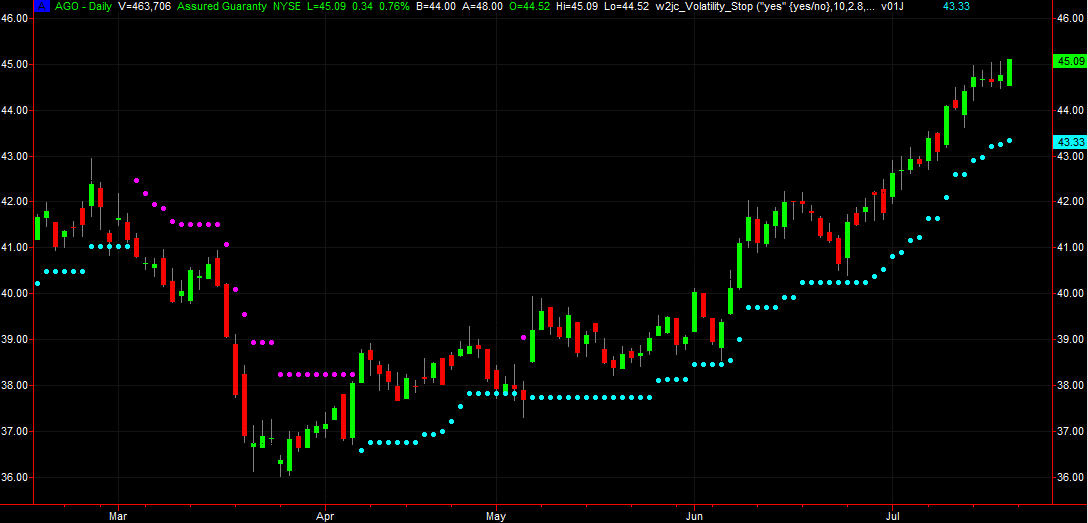
This is a very useful indicator for use with TradeStation charts, which has not been easily available in the past. It calculates stop levels based on the ATR of the recent candles/bars on the chart, which is a measure of the stock's volatility. This indicator provides a form of trailing stop, but the trailing is not based on a fixed percentage or dollar value; rather, it is based on the volatility (candle size) of recent trading.
The Volatility Stop indicator can also be used as a "trend reversal" indicator, when the stop levels flip to the opposite side.
In addition to displaying the Volatility Stop levels on your chart, this indicator can also be used to SCAN for all stocks that have just switched trend direction. This is an excellent scan to detect potential breakouts just as they are happening.
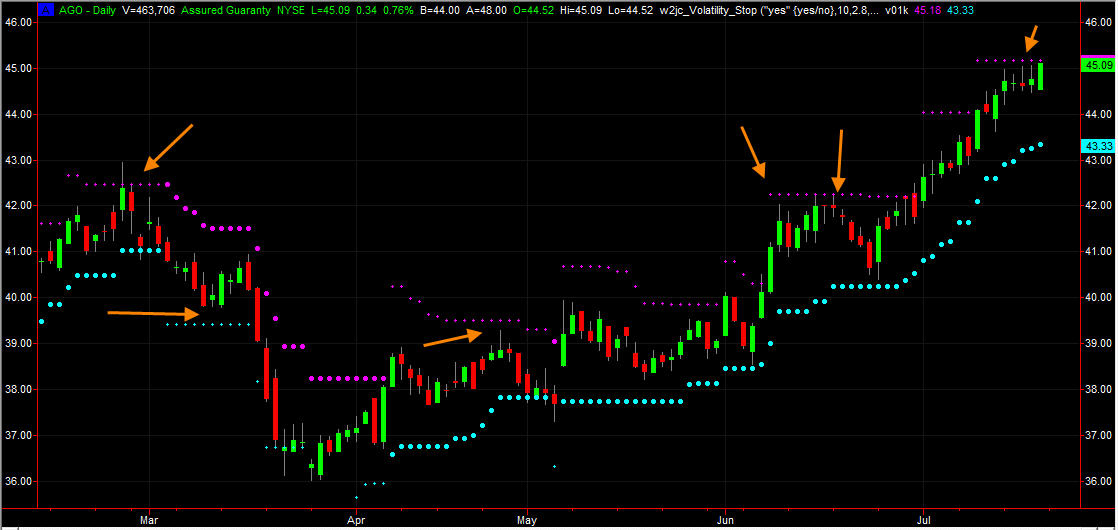
A special, unique feature of our Volatility Stop indicator is the option to turn on what we are calling "un-stops" which are on the opposite side from the normally displayed stop levels. These are generally not spaced the same distance away as the actual stops, but they have been found to be very useful for spotting resistance levels about to be encountered in the trend direction.
The chart below, which is the exact same chart as shown above, has the "un-stops" shown -- with arrows pointing to the display of resistance levels they show.
Another feature of this indicator is our unique and informative alert messages, which can be audible as well as text.
Very descriptive alerts are included in this indicator, which are configured so that audible alerts will be informative even if you are across the room and cannot see the chart! The alerts include the ticker, the time base of the chart ( # ticks, # minutes, daily, weekly or monthly), the type of chart (even Point & Figure!), the direction of movement, and a repeat of the ticker (in case you missed it at the start of the alert!). The company name can optionally be included in the alert messages.
Tickers used in the alerts are generated with a space between each letter, so that the Windows text-to-voice speaker used by TradeStation will pronounce them as individual letters instead of trying to pronounce the ticker as a word.
View the User Guide for an understanding of this indicator: [ click here for Volatility Stops User Guide ]
Request a TRIAL copy of this indicator: [ click here ]
(This should generate an email in your email program; if it does not, send a request to the address below.)
For more info, questions or suggestions please email me at: . . . indicators@JimCooper.org
Purchase now for $98.00
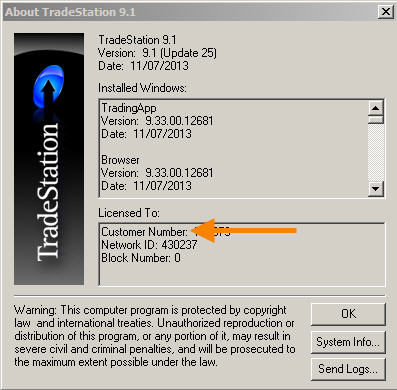
What is "TS Customer Number"? [click here]
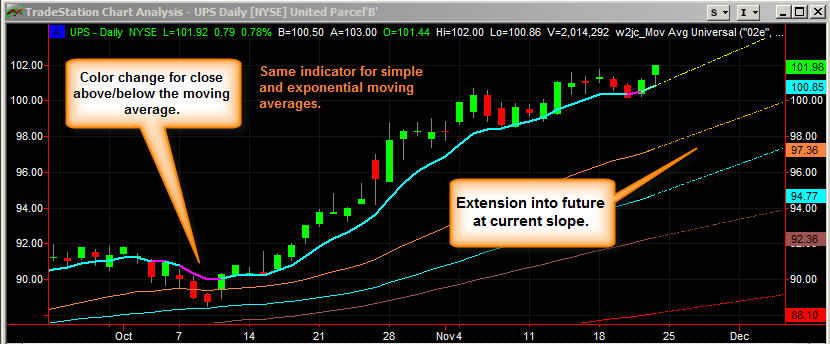
Universal Moving Average
The next package that I am making available publicly is my "Universal Moving Average" indicator -
one indicator for all your moving average needs (simple and exponential, with extension "into the future")!
Starting with the currently available version, v02R, this Universal Moving Average indicator can also be used in the TS Scanner and the TS Radar Screen, for scans and real-time alerts.
As with all our special indicators, the alerts are very detailed and explicit and can be set for audio readout as well.
The current version of the User's Guide can be fetched from here.
For more info, questions or suggestions please email me at:
indicators@JimCooper.org
Purchase now for $49.95
What is "TS Customer Number"? [click here]Request a TRIAL copy of this indicator: [ right click here ]
Volume vs. Average Volume (a new way of looking at volume spikes!)
Every charting package lets you put volume on the chart -- either as bars or as a line. And you can sort of pick out spikes in volume from them; but then you have to look up at the chart, line up the volume bar with the price bar or candle and decide if the price bar closed UP or DOWN to decide whether the volume spike was buying or selling pressure.
I've come up with a unique way to show you not only direction and magnitude of the volume, but also to relate it to the short-term past average volume. If a stock is chugging along with 'average' volume for many bars, there's probably not much happening with the price either. It's then that even a moderate increase in volume, which might not show up very well in the field of volume spikes, can be a warning of coming changes in sentiment.
Barry Burns, of TopDog Trading, has a nice video explaining how volume spikes can reveal trend changes.
Since he urges everyone to share the video, here is the link:
https://www.youtube.com/watch?v=FejfLTy215g
Now, compare visually the volume bars in his standard chart with the ones below. .
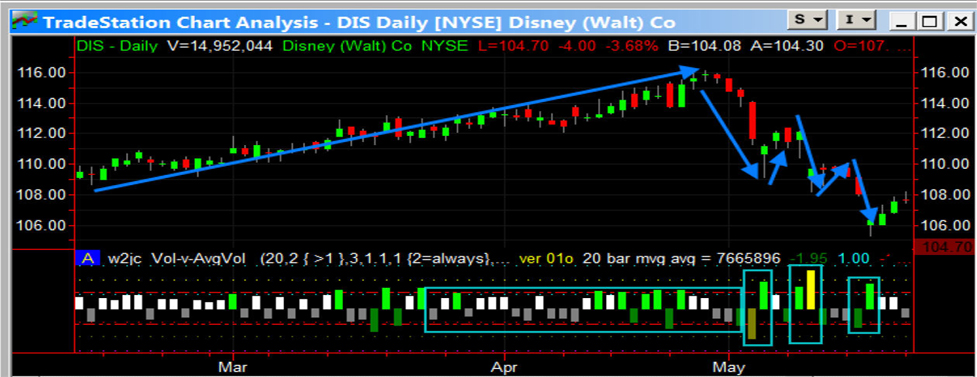
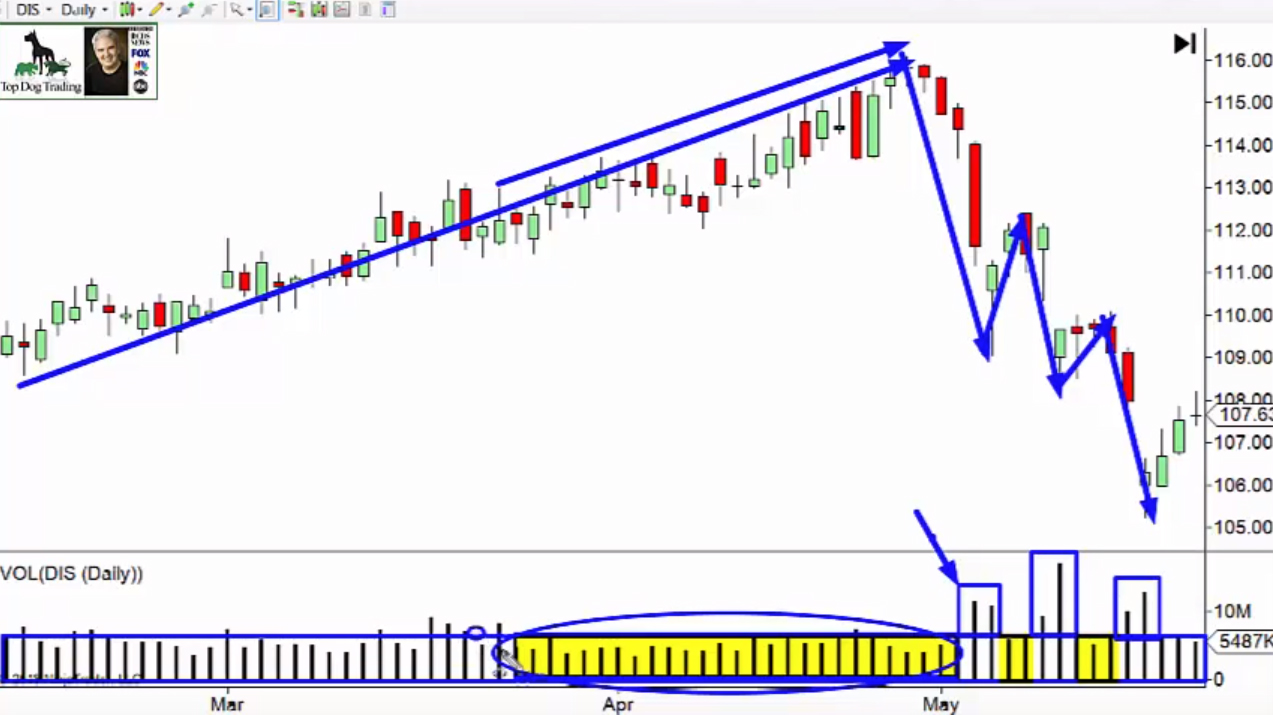
The two charts above show the exact same section of the DIS chart, for comparison purposes.
The black Tradestation chart above has our Volume-vs-Average-Volume indicator displayed. You can see easily which are up bars (buying) and which are down bars (selling). In addition, there are user-adjustable ratio levels for easy comparison -- the red lines enclose the AVERAGE volume over the selected lookback range. In this example, levels are set for 2:1 and 3:1 current volume to average volume ratio; and the vertical bar colors change so you can spot the level easily.
In addition, our proprietary detailed verbal alert system lets you monitor the chart even if you are in another room! AND this indicator can be used in Radar Screen as well as the Scanner.
If you prefer to have all the volume bars in one direction, but with dark colors for selling volume, that is an option as well - easily set in the Format / Input menu.
So ... if you believe that volume is an important indicator of market sentiment and possible trend changes you will LOVE this indicator! And we do not charge by the month to rent it ... one-time price and you can use it on ANY computer as long as you are logged into your Tradestation account.
Request a TRIAL copy of this indicator: [ right click here ]
For more info, questions or suggestions please email me at:
indicators@JimCooper.org
Purchase now for $79.95
What is "TS Customer Number"? [click here]
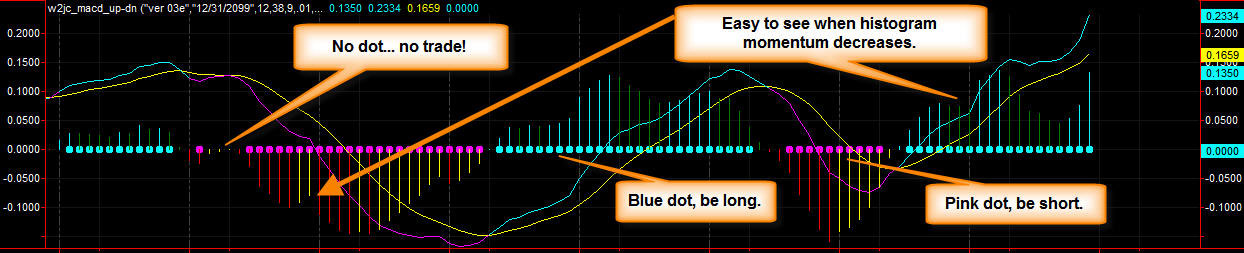
MACD (Moving Average Convergence Divergence) with up / down and trade indications
Another package that I am now making available publicly is my "MACD with up/down indicators" indicator - this indicator not only shows the "line" and the "histogram" display with one indicator, it also shows FOUR different colors on the histogram so you can immediately see the rising histogram begin to fall, and the falling histogram begin to rise! The Line display is color coded, so that when the line and the moving average are very close you don't have to guess whether the indicator is rising or falling. And finally there is, along the zero line, a set of "traffic light" dots which indicate when you should be long, when you should be short, and when you should not be in a position.
Download the current User Guide
to see all the features of this indicator --
CLICK HERE
For more info, questions or suggestions please email me at:
indicators@JimCooper.org
Purchase now for $39.95
What is "TS Customer Number"? [click here]
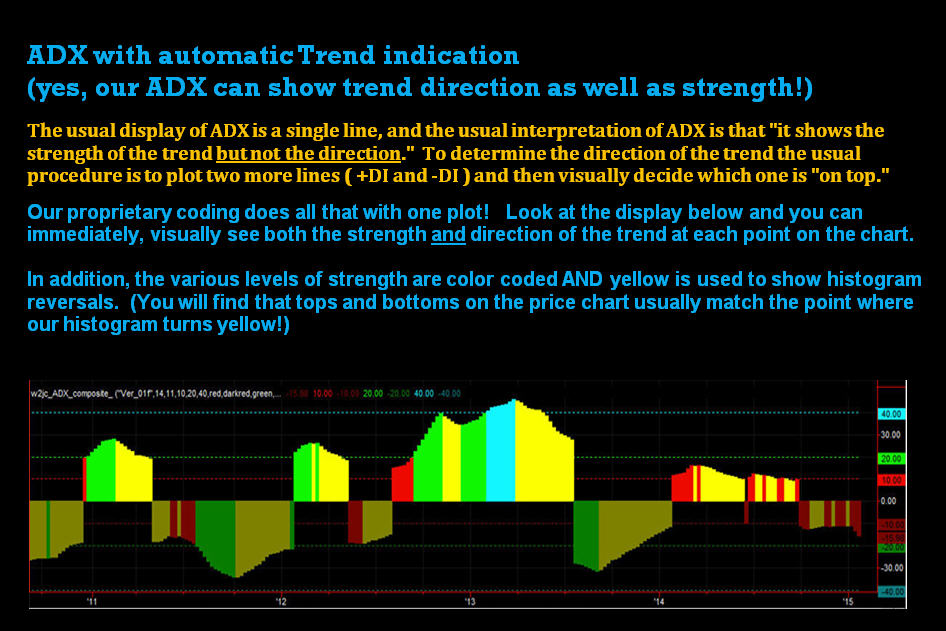
Purchase now for only $99. For more info, please send email to ADX@JimCooper.org
What is "TS Customer Number"? [click here]
Ichimoku Cloud
with simulated trades shown on chart - User Guide (current version) - 2 week trialAn excellent tutorial on using the Ichimoku Cloud can be found here * they also have training courses available.
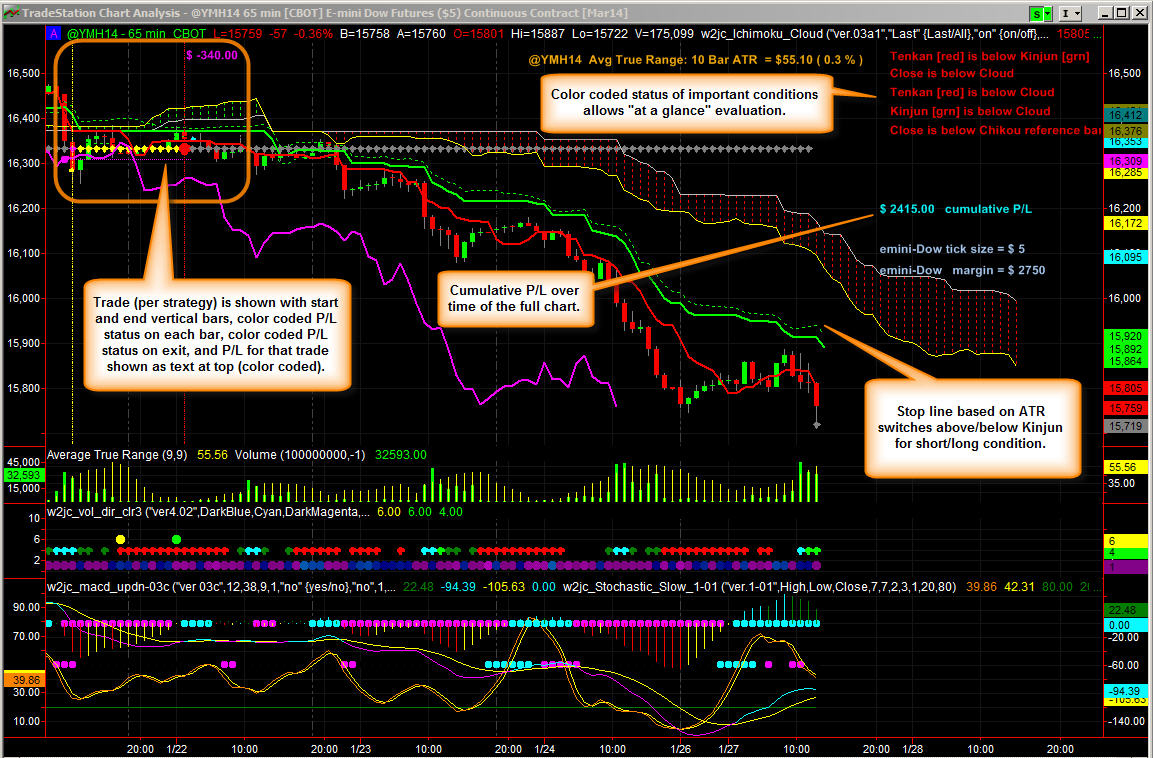
Comment: I believe that this implementation of the Ichimoku Cloud is one of the sharpest and clearest
presentations you will find anywhere - plus it has all the extra features noted above!
Note: indicators shown in the lower three sub-graphs are not included with the Cloud package.
Needless to say, this is a very customized arrangement so it is not something that can just be downloaded right away and installed.
Once you place your order, we will set everything up and make arrangements to get the files to you -- depending on your level of PC skills,
and we will work with you if necessary on the installation and setup.
Purchase now for only $189. For more info, please send email to Ichimoku@JimCooper.org
What is "TS Customer Number"? [click here]
PINBALL SETUP FINDER
The PINBALL chart pattern was first recognized and named by Rick Saddler, who operates the HitAndRunCandlesticks.com web site and training room.
I (Jim Cooper) have developed and coded an indicator for use with the Tradestation charting and trading platform.
This indicator displays, on any stock chart, the presence of the PINBALL PATTERN, as well as showing the ‘buy area’ which Rick suggests.
(The chart below shows an example of a chart with two PINBALL patterns).
The current version of the User's Guide can be fetched from here.
For more info, questions or suggestions please email me at:
pinball@JimCooper.org
In addition to the chart indicator, I have developed a SCAN which can be used in Tradestation to automatically FIND all the charts
which contain the Pinball Pattern RIGHT NOW… so you only have to look at those charts when you want to set up a Pinball Trade.
For now, we have set the price at $150 as a flat fee basis. This means you get everything you need to set up the Pinball Finder
on your Tradestation charts and scanner; it will be coded to work only in your account, but it will work on ANY PC you log in from,
as long as you are in your account. We will provide you with not only the indicator, but also a workspace template with everything installed for you.
Needless to say, this is a very customized arrangement so it is not something that can just be downloaded right away and installed.
Once you place your order, we will set everything up and make arrangements to get the files to you -- depending on your level of PC skills,
and we will work with you if necessary on the installation and setup.
Purchase now for only $150 "You'll make it back on the first trade!!"
What is "TS Customer Number"? [click here]
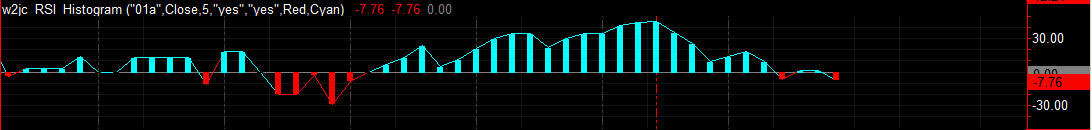
RSI Histogram & Line
RSI is usually interpreted by whether it is above or below
the center-line, so why not display it as up and down bars
(like MACD is often displayed)? This indicator provides both
the usual Line plot as well as up/down Histogram display; you
can display either style or both at the same time.
Purchase now for only $14.95
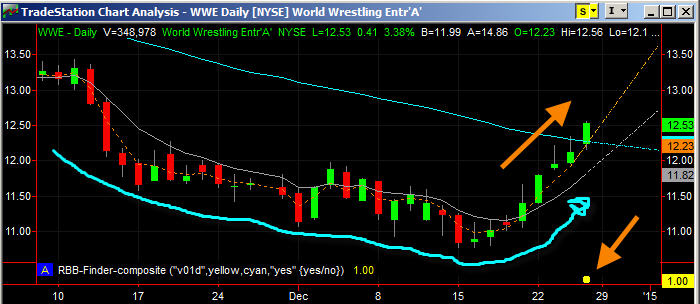
What is "TS Customer Number"? [click here] Rounded Bottom Breakout (RBB) pattern finder
The RBB pattern was detected and described by Rick Saddler, who is also known for detecting and describing the T-Line
trading techniques. The RBB is a powerful bullish breakout pattern, but it is a hard pattern to scan for because it can be
formed over a short time or a long time, it can be shallow or deep, etc. Click here for RBB User Guide & Description.
Purchase now for only $79. For more info, please send email to RBB@JimCooper.org
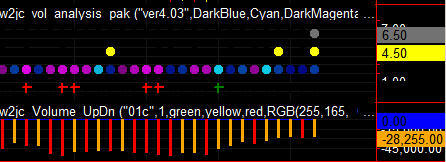
What is "TS Customer Number"? [click here]Volume Analysis pack
Note: Except for the bottom (Fourth) row of ++ this package works only for TICK charts.
Top row shows 'tick' countdown to next candle;
Second row shows 'up vol on dn candle' and 'dn vol on up candle';
Third row shows, by gradient color, degree of up or down volume;
Fourth row shows half, 2x and 3x average volume - alert to vol. spikes.
Free add-on: color coded up/down volume bars.
Purchase now for only $49
What is "TS Customer Number"? [click here]
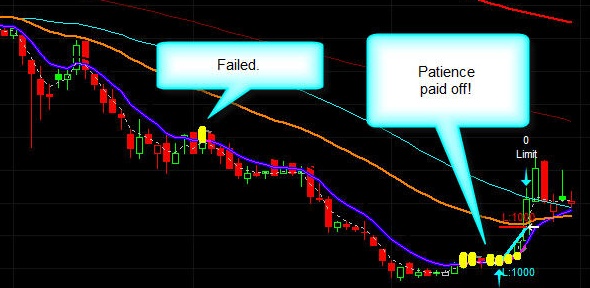
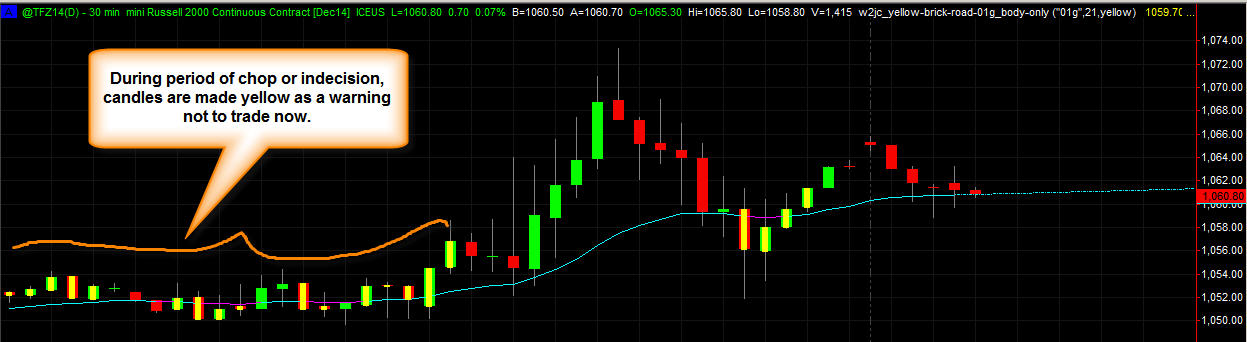
"Yellow Brick Road" - marks candles in "chop" condition (times to not trade!)
One of the fastest way to lose money trading is trying to trade during periods
of what is called "chop." During these times, it is best to find another chart!
But how can you spot this condition easily? Our "Yellow Brick Road" does it
for you, by marking the candles as "yellow bricks" - warning you not to trade.
Purchase now for only $19.95
What is "TS Customer Number"? [click here]
WHAT ELSE?
Here is a list of indicators which I have either developed or modified/enhanced... I use them for my own trading, but have not made them available publicly so far. If you see one you might be interested in, let me know and I'll make a priority of preparing it for sharing.
- 10-bar New High
- ATR text display
- Average price line
- BG Status Board
- "Best Friend" Candlestick Pattern ( "doji plus gap up/down" per Steve Bigalow- CandlestickForum.com )
Use this package for Scanning all stocks ... in Radar Screen for continuous update of watchlists ... and in Charts to spot the pattern.
- Bollinger Bands Universal (use either simple or exponential moving average as center line)
- Composite CCI (with snap-up & snap-down flags; concept by David Elliott)
- Data inversion
- Doji reversal
- DPO with average and mobo
- Ease of Movement
- Float Box
- Good Night Gold (with simulated trades shown on chart)
- Hull moving average
- Linear Regression Line Slope
- MACD with up/down indications (See big section above).
- Momentum
- Multiple average volume
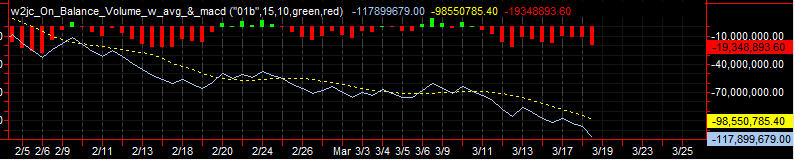
- OBV (On-Board Volume) with moving average and histogram (macd)
- Open Bar Range
- Opening Range
- Parabolic SAR
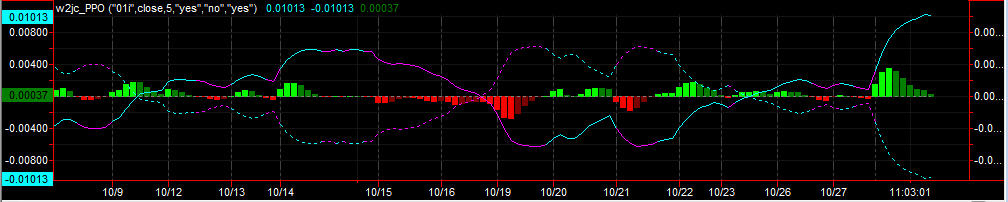
- PPO (Price Percent Oscillator)
- Rate of Change
- Reversal Trendlines
- Session hi-lo
- SOAP Composite (based on concepts by David Elliott)
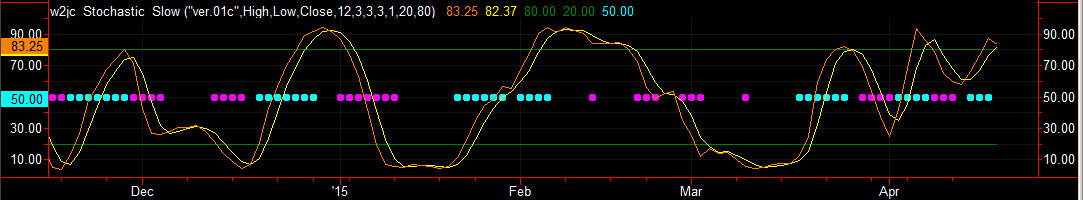
- Stochastic Slow
Includes color "traffic lights" which go off when stochastic lines are very close together (how close is user adjustable)
Purchase now for only $19.95
- Tick Counter (shows how many ticks are left before new bar is formed)
- volume direction
- volume directional bar
- volume moving average
- volume spike flag
- volume spike price
- Volume Up/Down color
- ZigZag Percent